Logging from Workers
You can access logs and exceptions for your Workers using the dashboard or wrangler tail.
The Workers platform captures all console.log’s and uncaught exceptions, in addition to information about the event itself. All of this can be viewed with either wrangler tail or on the dashboard through your Account Home > Workers > your Workers script > Logs.
Adding custom logs
Any console.log statements within your Worker will appear within wrangler tail and the dashboard output. The following example demonstrates a custom console.log within a Worker request handler.
export default {  async fetch(request) {    const { cf } = request;    const { city, country } = cf;
    console.log(`Request came from city: ${city} in country: ${country}`);
    return new Response("Hello worker!", {      headers: { "content-type": "text/plain" },    });  }
}
addEventListener("fetch", (event) => {  event.respondWith(handleRequest(event.request));
});

/** * Respond with hello worker text * @param {Request} request */
async function handleRequest(request) {  const { cf } = request;  const { city, country } = cf;
  console.log(`Request came from city: ${city} in country: ${country}`);
  return new Response("Hello worker!", {    headers: { "content-type": "text/plain" },  });
}
After you deploy the above code, run wrangler tail in your terminal, and then access your Worker. Your terminal will display:
$ wrangler tail --format=pretty[2021-08-18 17:06:55] [LAX] [Ok] GET https://logging-example.jkup.workers.dev/ | [Info] Request came from city: Pacifica in country: US[2021-08-18 17:06:56] [LAX] [Ok] GET https://logging-example.jkup.workers.dev/favicon.ico | [Info] Request came from city: Pacifica in country: US
View logs using wrangler tail
With your Workers application deployed, you may want to inspect incoming traffic. This may be useful in situations where a user is running into production issues that they cannot easily reproduce. In these instances, wrangler tail allows developers to livestream their Workers application’s logs, giving real-time insight into their application’s incoming requests.
To get started, run wrangler tail in your Workers project directory. This will log any incoming requests to your application available in your local terminal.
The output of each wrangler tail log is a structured JSON object:
{  "outcome": "ok",  "scriptName": null,  "exceptions": [],  "logs": [],  "eventTimestamp": 1590680082349,  "event": {    "request": {      "url": "https://www.bytesized.xyz/",      "method": "GET",      "headers": {},      "cf": {}    }  }
}
By piping the output to tools like jq, you can query and manipulate the requests to look for specific information:
$ wrangler tail | jq .event.request.url"https://www.bytesized.xyz/""https://www.bytesized.xyz/component---src-pages-index-js-a77e385e3bde5b78dbf6.js""https://www.bytesized.xyz/page-data/app-data.json"You can customize how wrangler tail works to fit your needs: refer to the wrangler tail documentation for available configuration options.
View logs from the dashboard
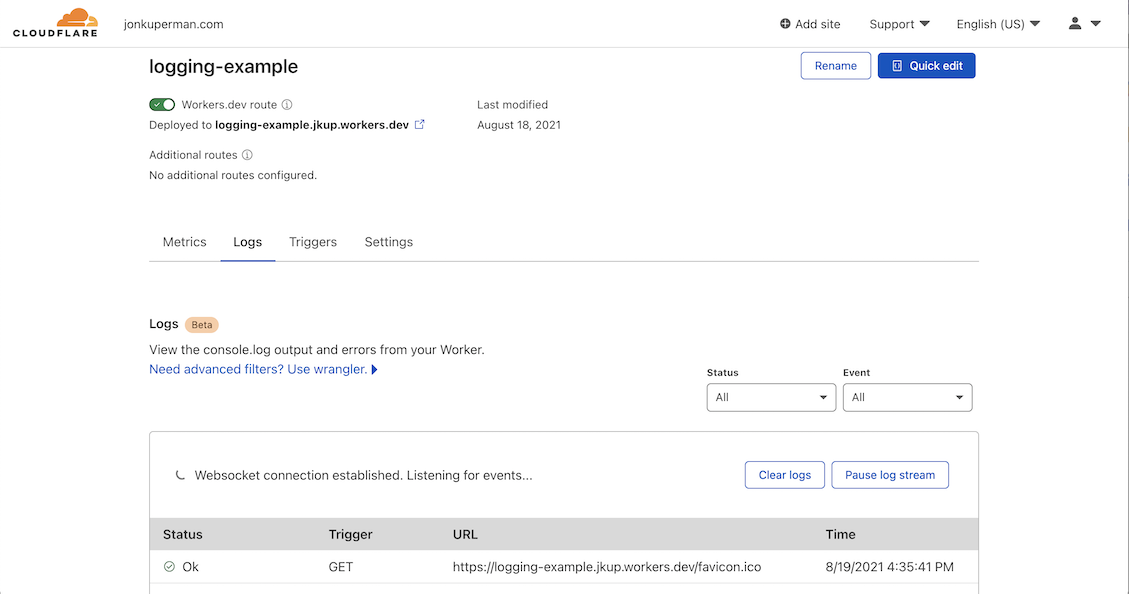
You can review the production logs associated with any Worker by logging in to the Cloudflare dashboard. From your Account Home > go to Workers > select your Worker > and select Logs. Logging is available for all customers, including those on the free plan.
Note that:
- Workers logs are not stored. You can start and stop the stream at any time to view them, but they do not persist.
- Logs will not display if the Worker’s requests per second are over 200 for the last 5 minutes.
- Logs from any Durable Objects your Worker is using will show up in the dashboard.
- A maximum of 10 clients can view a Worker’s logs at one time. This can be a combination of either dashboard sessions or
wrangler tailcalls.
Push logs to storage
Workers Logpush allows you to send Workers Trace Event Logs to a supported destination. Worker’s Trace Events Logpush includes metadata about requests and responses, unstructured console.log() messages and any uncaught exceptions.
Refer to the Workers Logpush documentation to learn how to create and configure Logpush jobs.
Identifying and handling errors and exceptions
Error pages generated by Workers
When a Worker running in production has an error that prevents it from returning a response, the client will receive an error page with an error code, defined as follows:
| Error code | Meaning |
|---|---|
| 1101 | Worker threw a JavaScript exception. |
| 1102 | Worker exceeded CPU time limit. |
| 1015 | Your client IP is being rate limited. |
| 1027 | Worker exceeded free tier daily request limit. |
| 1042 | Worker tried to fetch from another Worker on the same zone, which is unsupported. |
Other 11xx errors generally indicate a problem with the Workers runtime itself. Refer to the status page if you are experiencing an error.
Identifying errors: Workers Metrics
You can find out whether your application is experiencing any downtime or returning any errors by navigating to Account Home > Workers > your Worker and reviewing your Worker’s summary in Resources.
Debugging exceptions
After you have identified your Workers application is returning exceptions, use wrangler tail to inspect and fix the exceptions.
Exceptions will show up under the exceptions field in the JSON returned by wrangler tail. After you have identified the exception that is causing errors, redeploy your code with a fix, and continue tailing the logs to confirm that it is fixed.
Set up a logging service
A Worker can make HTTP requests to any HTTP service on the public Internet. You can use a service like Sentry to collect error logs from your Worker, by making an HTTP request to the service to report the error. Refer to your service’s API documentation for details on what kind of request to make.
When using an external logging strategy, remember that outstanding asynchronous tasks are canceled as soon as a Worker finishes sending its main response body to the client. To ensure that a logging subrequest completes, pass the request promise to event.waitUntil(). For example:
export default {  async fetch(request, env, ctx) {    function postLog(data) {      return fetch("https://log-service.example.com/", {        method: "POST",        body: data,      });    }
    // Without ctx.waitUntil(), the `postLog` function may or may not complete.    ctx.waitUntil(postLog(stack));    return fetch(request);  }
}
addEventListener("fetch", (event) => {  event.respondWith(handleEvent(event));
});

async function handleEvent(event) {  // ...
  // Without event.waitUntil(), the `postLog` function may or may not complete.  event.waitUntil(postLog(stack));  return fetch(event.request);
}

function postLog(data) {  return fetch("https://log-service.example.com/", {    method: "POST",    body: data,  });
}
Go to origin on error
By using event.passThroughOnException, a Workers application will forward requests to your origin if an exception is thrown during the Worker’s execution. This allows you to add logging, tracking, or other features with Workers, without degrading your application’s functionality.
export default {  async fetch(request, env, ctx) {    ctx.passThroughOnException();    // an error here will return the origin response, as if the Worker wasn't present    return fetch(request);  }
}
addEventListener("fetch", (event) => {  event.passThroughOnException();  event.respondWith(handleRequest(event.request));
});

async function handleRequest(request) {  // An error here will return the origin response, as if the Worker wasn’t present.  // ...  return fetch(request);
}