Using Cloudflare Logs (ELS) to Investigate DDoS Traffic (Enterprise Only)
Overview
With Cloudflare Logs (formerly ELS) you have access to useful data for analyzing traffic that might show patterns associated with a DDoS attack. You can perform this type of analysis by sorting your Cloudflare Logs data. To get started, follow the steps outlined below and review the example workflow provided.
Before following these instructions, you need:
Step 1: Gather the information you need before querying Cloudflare Logs
Gather the following information:
- Zone administrator email address
- Zone ID (found under Overview>Zone ID)
- Client API key
- Start time (example format: 1529171100)
- End time (example format: 1529171100)
Step 2: Download and save the logs
The Cloudflare endpoint has a 1 hour time swath limit and the logs file size must be under 1GB per request. If the file size exceeds 1GB, the download will cut off at 1GB even if logged events from the time requested are not included. To avoid truncating your logs, decrease the time from 1 hour to 45 minutes and so on until the log file size is under 1GB.
Option 1: Download all fields
Download all fields from Cloudflare Logs, save to els.txt:
Template:
$ curl -sv -o els.txt -H "X-Auth-Email: email" -H "X-Auth-Key: api key" "https://api.cloudflare.com/client/v4/zones/zone id/logs/received?start=starttime&end=endtime&fields=(curl -s -H "X-Auth-Email: email" -H "X-Auth-Key: api key" "https://api.cloudflare.com/client/v4/zones/zone id/logs/received/fields" | jq '. | to_entries[] | .key' -r | paste -sd "," -)"
Example (with values):
$ curl -sv -o els.txt -H "X-Auth-Email: monkey@bannana.com" -H "X-Auth-Key: api key" "https://api.cloudflare.com/client/v4/zones/5b5f0xxxcbfbaxxxxxx0416d22f7b/logs/received?start=1529171100&end=1529171100&fields=(curl -s -H "X-Auth-Email: monkey@bannana.com" -H "X-Auth-Key: api key" "https://api.cloudflare.com/client/v4/zones/zone id/logs/received/fields" | jq '. | to_entries[] | .key' -r | paste -sd "," -)"
Option 2: Download specific fields
Download specific fields from Cloudflare Logs, save to els.txt:
This command will include only the following fields in the logs you requested: CacheCacheStatus, CacheResponseBytes, CacheResponseStatus, CacheTieredFill, ClientASN.
Refer to the full list of Cloudflare Logs fields here. Template:
$ curl -sv -o els.txt-H "X-Auth-Email:email" -H "X-Auth-Key:api key" "https://api.cloudflare.com/client/v4/zones/zone id/logs/received?start=starttime&end=endtime&fields=CacheCacheStatus,CacheResponseBytes,CacheResponseStatus,CacheTieredFill,ClientASN”
Example (with values):
$ curl -sv -o els.txt-H "X-Auth-Email:monkey@bannana.com" -H "X-Auth-Key:api key" "https://api.cloudflare.com/client/v4/zones/xx5x0xxxc45baxxxxxx0x6d23fxx/logs/received?start=1529171100&end=1529171100&fields=CacheCacheStatus,CacheResponseBytes,CacheResponseStatus,CacheTieredFill,ClientASN”
Step 3: Sort the logs
Sort the logs by field value and output them to a file.
- Sort by HTTP 200 response, output to file called els-200.txt
$ cat els.txt| grep ":200," > els-200.txt
- Sort by HTTP 525 response, output to file called els-525.txt
$ cat els.txt| grep ":525," > els-525.txt
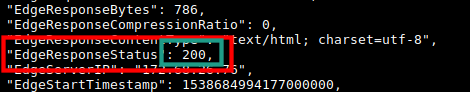
Where does the field value “:525,” come from?
The pattern :525, (colon, status code, comma) is unique to the EdgeResponseStatus field. Simply searching the HTTP status code 525 without a colon and trailing comma would also include log entries which had the pattern 525 in other fields like EdgeStartTimeStamp, for example, which contains many numbers and may also contain the number sequence 525.
The output files (els-200.txt and els-525.txt) are not very readable as-is. In order to view them in a more readable format, use jq in the following command:
$ cat els-525.txt | jq '.'
Count the requests by field and output them to a file
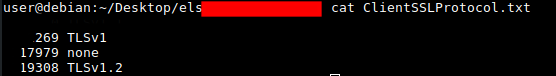
In this example, we count requests by SSL protocol version, which is denoted by the ClientSSLProtocol field in Cloudflare Logs (note the period before the field name below).
$ jq -r .ClientSSLProtocol els-200.txt |sort -n |uniq -c |sort -n > ClientSSLProtocol.txt
$ cat ClientSSLProtocol.txt
Example Output:
The ClientRequestURI, ClientIP, ClientRequestUserAgent, ClientCountry and ClientRequestHost fields are typically the most useful in finding attack patterns in these logs.
- Sorting by ClientRequestUserAgent allows you to set User Agent blocking rules.
- Sorting by ClientCountry allows you to set firewall rules based on country.
- Sorting by ClientRequestURI will allow you to set rate limiting rules for the pages with the highest number of requests.
Example workflow
Often, you’ll need to sort by many fields to analyze and identify the source of an attack. For example, take a look at the following workflow:
Action 1: Sort your downloaded Cloudflare Logs by HTTP 200 response, output to els-200.txt.
Reason: You’re not interested in responses that are being blocked by Cloudflare already; that is, requests which result in a HTTP response 503 or 403. A request that results in a 200 HTTP response at our edge is not blocked by Cloudflare and is likely going all the way through to the origin if the asset is not cached on Cloudflare’s edge. Such requests, when malicious, are designed specifically to overburden the origin.
How to:
$ cat els.txt | grep ":200," > els-200.txt
Action 2: Sort your “HTTP 200 only” logs by URI, output to els-200-URI.txt.
Reason: Of the 200 responses, you want to see the pages which are being requested the most. How to:
Find the top URIs:
$ jq -r .ClientRequestURI els-200.txt |sort -n |uniq -c |sort -n > els-200-top-URIs.txt
$ cat els-200-top-URIs.txt
Pick a URI from this list and output log entries with that URI to their own file. To do this, replace /ClientRequestURI/path/to/something/ in the command below with the URI of your choosing:
~$ cat els-200.txt| grep "/ClientRequestURI/path/to/something/" > els-200-URI-1.txtAction 3: Count URI Specific, “HTTP 200 only” responses by IP address, output to els-200-URI-1-Top-IP.txt
Reason: You want to see the top IP addresses which are requesting the URI and resulting in a 200 response.
How to:
$ jq -r .ClientIP els-200-URI-1.txt |sort -n |uniq -c |sort -n > els-200-URI-1-Top-IP.txt
Output the contents of the file:
$ cat els-200-URI-1-Top-IP.txt
You can narrow down 200 HTTP responses by both the request URI and the IPs which are requesting those URIs. You could also sort the logs the other way round, narrowing down the log entries by top IP addresses and then seeing which URI is requested the most by IP address.