Monitoring Tunnels with Grafana
When a Tunnel is run, cloudflared will automatically spin up a metrics server. This metrics server can be routed to Prometheus and Grafana in order to convert the metrics into actionable insights.
By default, the port that metrics are sent to is randomly selected and can be found by viewing Tunnels logs as seen below:
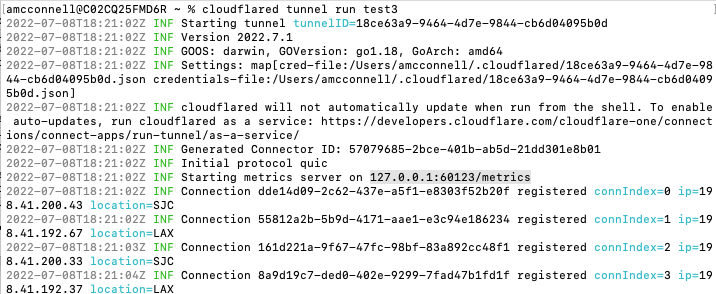
The port is highlighted in the above image.
However, it can also be manually set with the following configuration.
$ cloudflared tunnel --metrics <service-URL>:<service-port> run <TUNNEL NAME>
Setting Up Prometheus
If you do not already have Prometheus installed, follow this guide to get started.
In the folder created when Prometheus was downloaded you will find a config file named “prometheus.yml”.
Make the following additions to the end of the config file.
# my global config
global:  scrape_interval: 15s # Set the scrape interval to every 15 seconds. Default is every 1 minute.  evaluation_interval: 15s # Evaluate rules every 15 seconds. The default is every 1 minute.  # scrape_timeout is set to the global default (10s). # Alertmanager configuration
alerting:  alertmanagers:    - static_configs:        - targets:          # - alertmanager:9093 # Load rules once and periodically evaluate them according to the global 'evaluation_interval'.
rule_files:  # - "first_rules.yml"  # - "second_rules.yml" # A scrape configuration containing exactly one endpoint to scrape:
# Here it's Prometheus itself.
scrape_configs:  # The job name is added as a label `job=<job_name>` to any timeseries scraped from this config.  - job_name: 'prometheus'     # metrics_path defaults to '/metrics'    # scheme defaults to 'http'.     static_configs:      - targets: ['localhost:9090'] ## Port that prometheus will go to   ## ADD HERE  - job_name: '<job name>' ##NAME FOR JOB    static_configs:      - targets: ['<service-URL>:<service-port>']  ##PORT THAT TUNNEL SENDS METRICS TOO
To start Prometheus, from within the Prometheus folder enter:
$ ./prometheus --config.file="prometheus.yml"
This can also be configured to run as a service so that it does not need to be manually started if the machine reboots.
Heading to http://localhost:9090/ will show the Prometheus dashboard for this Tunnel. To have the Prometheus dashboard run on a different port change the port selection from 9090 to the desired port in the config file.
Setting Up Grafana
If you do not already have Grafana installed, follow this guide to get started.
Grafana can be started with the following command.
$ /usr/local/opt/grafana/bin/grafana-server --config /usr/local/etc/grafana/grafana.ini --homepath /usr/local/opt/grafana/share/grafana --packaging=brew cfg:default.paths.logs=/usr/local/var/log/grafana cfg:default.paths.data=/usr/local/var/lib/grafana cfg:default.paths.plugins=/usr/local/var/lib/grafana/plugins
Heading to http://localhost:3000/ will show the Grafana dashboard for this Tunnel. To have the Grafana dashboard run on a different port edit the port selection from 3000 to the desired port in the grafana.ini config file .
Like with Prometheus, Grafana can be configured to run as a so that it does not need to be manually restarted if the machine reboots.
Connecting Prometheus to Grafana
Go to the site that Grafana is listening on.
In the bottom left corner of the page click on the gear and then Data Sources.
Click “Add data source” and select Prometheus from the options. Enter the url that leads to the site that shows the Prometheus dashboard.
A dashboard can now be created within Grafana to monitor Tunnel metrics.
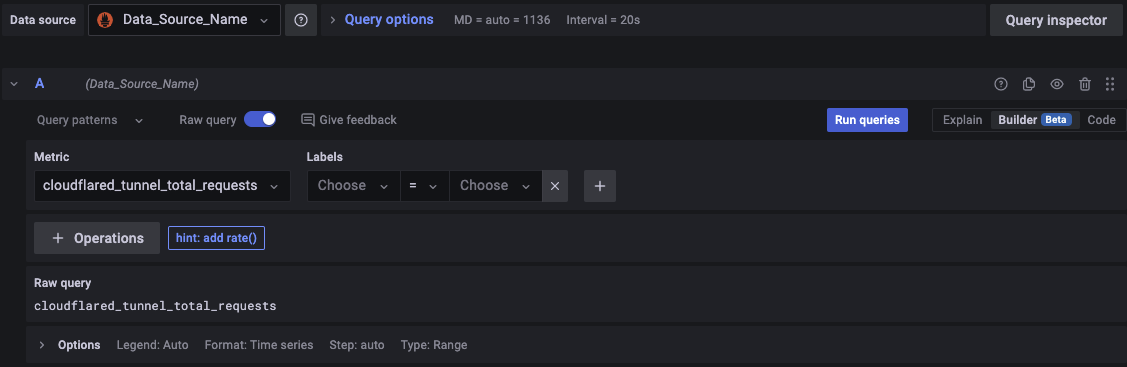
Select the new data source and enter the Prometheus queries to monitor.
Some simple queries to start with are “cloudflared_tunnel_request_errors” and “cloudflared_tunnel_requests”.
Create a new dashboard and then in the upper right corner of the page click the “Add panel” button, and “Add a new panel”.
Select the above metric names in the metrics drop down to populate a graph with them.
Operations can be added to the queries to modify what is displayed. For example, showing all tunnel requests to showing all tunnel requests over a recent period of time, such as a day rather than all tunnel requests since metrics began reporting.