Adjust the displayed data
Select high-level metric
To toggle your view of the data, click the Total packet rate or Total bit rate side panels.
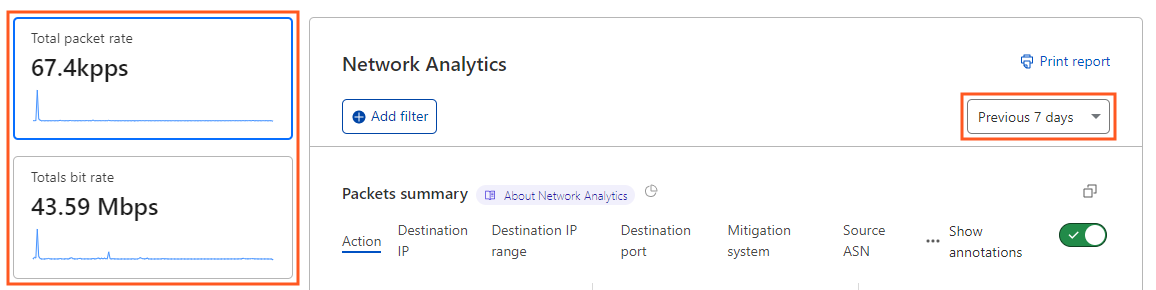
The selected metric will determine the base units (packets or bits) used in the several analytics panels displayed in the dashboard.
Select a dimension
Under Packets summary or Bits summary, select one of the available dimensions to view the data along that dimension. The default dimension is Action.
Apply filters
You can apply multiple filters and exclusions to adjust the scope of the data displayed in Network Analytics. Filters affect all the data displayed in the Network Analytics page.
There are two ways to filter Network Analytics data: using the Add filter button or clicking one of the stat filters.
Use the Add filter button
Click Add filter to open the New filter popover. Specify a field, an operator, and a value to complete your filter expression. Click Apply to update the view.
Use a stat filter
To filter based on the type of data associated with one of the Network Analytics stats, use the Filter and Exclude buttons that display when you hover your pointer over the stat.
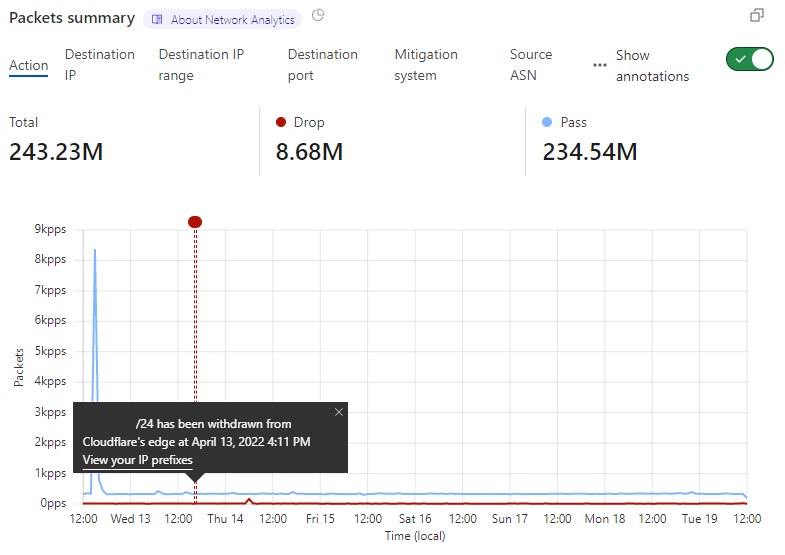
Show IP prefix events
Enable the Show annotations toggle to show or hide annotations for advertised/withdrawn IP prefix events in the Network Analytics view. Click each annotation to get more details.