Zone Analytics
The Cloudflare zone analytics is a major component of the overall Cloudflare Analytics product line. Specifically, this app gives you access to a wide range of metrics, collected at the website or domain level.
View your website analytics
To view metrics for your website:
- Log in to the Cloudflare dashboard.
- Click the appropriate Cloudflare account for your site, then pick the domain.
- Next, click the Analytics app icon.
Once it loads, the Analytics app displays a set of tabs for Traffic, Security, Performance, DNS, Workers, and Logs (Enterprise domains only). To understand the various metrics available, refer to Review your website metrics below.

Pro, Business, and Enterprise plans, refer to the latest Web Analytics under the Traffic tab.

Review your website metrics
This section outlines the metrics available under each Analytics app tab. Before proceeding, note that each tab may contain:
- One or more panels to further categorize the underlying metrics, and
- a dropdown (on the panel’s top right) to filter metrics for a specific time period. The time period you can select may vary based on the Cloudflare plan that your domain is associated with.
Below is a summary of each Analytics app tab.
Traffic
Free plan
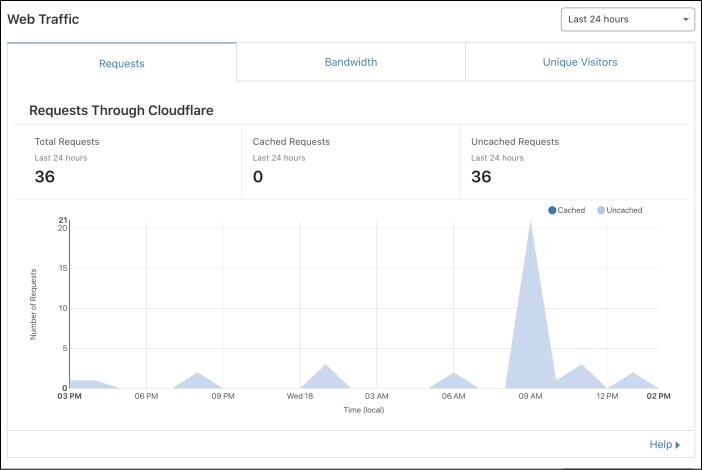
These metrics include legitimate user requests as well as crawlers and threats. The Traffic tab features the following panels:
- Web Traffic - Displays metrics for Requests, Bandwidth, Unique Visitors, and Status Codes. Note that if you use Cloudflare Workers, subrequest analytics are available under the Workers tab.
- Web Traffic Requests by Country - Is an interactive map that breaks down the number of requests by country. This panel also includes a data table for Top Traffic Countries / Regions that display the countries with the most number of requests (up to five, if the data exists).
- Share Your Stats - Lets you share actual site statistics on social media (Twitter) for: Bytes saved, SSL requests served, and attacks blocked.
Pro, Business, or Enterprise plan
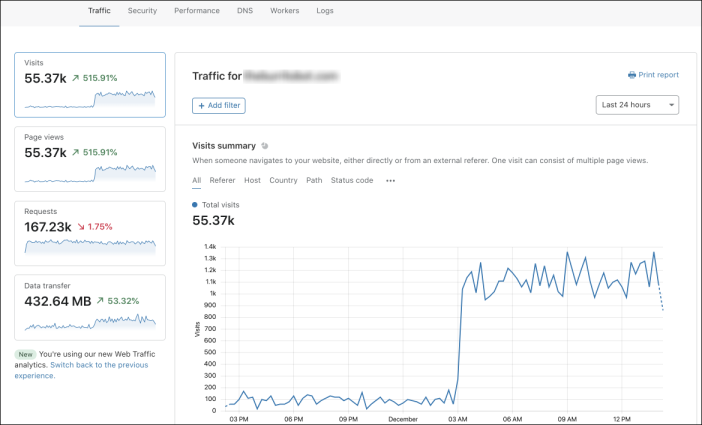
Analytics are based on Cloudflare’s edge logs, with no need for third party scripts or trackers. The Traffic tab features the following metrics:
- Visits - A visit is defined as a page view that originated from a different website, or direct link. Cloudflare checks where the HTTP referer does not match the hostname. One visit can consist of multiple page views.
- Page views - A page view is defined as a successful HTTP response with a content-type of HTML.
- Requests - An HTTP request. A typical page view requires many requests.
- Data Transfer - Total HTTP data transferred in requests.
To receive more detailed metrics, Add filter. You can also filter each metric by Referer, Host, Country, Path, Status code, Origin status code, Browser, Operating system, or Device type.
To change the time period, use the dropdown menu on the right-hand side above the graph. You can also drag to zoom on the graph.
Security
For this tab, the number and type of charts may vary based on existing data and customer plan. Most of the metrics in this tab come from the Cloudflare Firewall app. The panels available include:
- Threats - Displays a data summary and an area chart showing threats against the site.
- Threats by Country - Is an interactive map highlighting the countries where threats originated. It also includes data tables with statistics on Top Threat Countries / Regions and Top Crawlers / Bots.
- Rate Limiting (add-on service) - Features a line chart highlighting matching and blocked requests, based on rate limits. To learn more, consult Rate Limiting Analytics.
- Overview - Displays a set of pie charts for: Total Threats Stopped, Traffic Served Over SSL, and Types of Threats Mitigated. If available, the expandable Details link display a table with numerical data.
Performance
The metrics aggregated under this tab span multiple Cloudflare services. The panels available include:
- Origin Performance (Argo) (add-on service) - Displays metrics related to response time between the Cloudflare edge network and origin servers for the last 48 hours. For additional details, refer to Argo Analytics.
- Overview - Displays a set of pie charts for: Client HTTP Version Used, Bandwidth Saved, and Content Type Breakdown. If available, the expandable Details link display a table with numerical data.
DNS
The DNS tab presents several statistics for DNS queries. Note that metrics are available as long as Cloudflare is the site’s authoritative DNS server, even if the site is not proxied by Cloudflare. Therefore, DNS metrics are not offered for sites with a CNAME Setup.
The metrics panels available under the DNS tab include:
- DNS Queries - Displays several area charts and data tables for DNS record metrics including queries by Response Code, Record Type as well as records that return an NXDOMAIN response (dns record doesn’t exist). You can filter by one or several DNS records by entering record names (for example, www.example.com) in the dropdown near the top.
- DNS Queries by Data Center - Lets you view DNS query distribution across Cloudflare’s data centers. Metrics appear as interactive maps and data tables, and include statistics for Traffic, NXDOMAIN, and NOERROR.
Workers
This panel features metrics for Cloudflare Workers. To learn more, read Cloudflare analytics with Workers.
Logs
The Logs tab is not a metrics feature. Instead, Customers in the Enterprise plan can enable the Cloudflare Logs Logpush service. You can use Logpush to download and analyze data using any analytics tool of your choice.